![]()
Statistical Demonstrations
|
Statistical Demonstrations |
|
|
Spurious Correlations (Excel simulation) Playground, correlation & regression.xls (Excel simulation) Regression & correlation -- rice.edu
|
|
Unit |
Concepts |
Description |
|
|
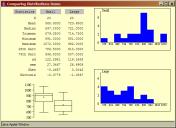
Graphs & Normal Curve |
·
Distribution ·
Histogram ·
Normal curve |
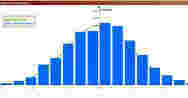
[Select histogram and boxplot for
continuous distribution.] Adjust
the settings, then watch as the computer gradually plots 1000 points,
represented as a histogram. See
how the resulting histogram approximates the normal curve. |
|
|
|
·
Distribution ·
Histogram ·
Normal Curve |
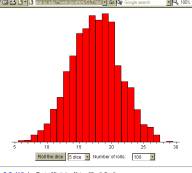
Determine how many dice to roll, and now
many rolls to throw on each click, then click away. If throwing only one dice, the distribution is rectangular.
If throwing five dice, distribution approaches a normal curve. |
|
|
Graphs & Normal Curve |
·
Distribution ·
Normal curve |
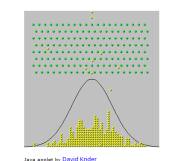
Balls dropped through “pin-ball”
matrix bounce randomly into a normal distribution.
Takes a few minutes to see bell-shaped pattern develop. |
|
|
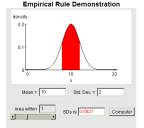
Descriptive Stats |
·
Normal Curve ·
Mean ·
Standard Deviation |
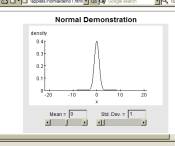
Change mean and standard deviation
manually and watch changes to graph of normal curve. |
|
|
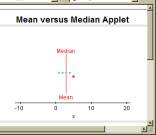
Descriptive Stats |
·
Mean ·
Median ·
Skew |
Change the value of 1 out of 5 scores
and watch how this affects the mean and median differently. |
|
|
Z-scores |
·
Descriptive Statistics ·
Z-scores ·
Standard Normal Curve ·
Converting raw scores to standard
scores |
Set the mean and standard deviation for
a distribution, and then adjust the z-score slider [labeled area within].
The higher you slide the z-score, the higher proportion of scores
fall between the two z-scores.
the curve you highlight.
Shows relation between z-score (position on standard
normal curve) and the relative percent of scores covered. |
|
|
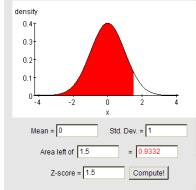
Z-scores & t-scores |
·
Normal curve ·
z-scores |
Similar to above except it shows the
area falling below a given z-score. |
|
|
Z-scores & t-scores |
·
Frequency distribution vs.
Standard error ·
Changes in sample size |
Generate distributions of sample means
for samples of 1,4,9,16,25 people. See
how standard error of the mean decreases as n increases. |
|
|
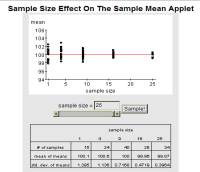
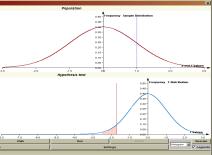
z-scores & t-scores |
·
Frequency Distribution ·
Sample Mean vs. Population Mean ·
Sampling Distributions |
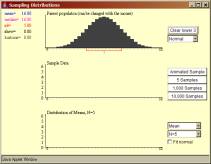
[Read description & then hit the
“Begin” button.] Pull
samples from parent population and watch resulting distribution of sample
means (ie, the sampling distribution) take shape.
Note that (with a large enough sample) the sampling distribution
matches the mean of the parent distribution, but shows less variability. |
|
|
Z and t-tests |
·
t-test distribution |
As the sample size increases, the
t-distribution approaches the shape of the z-distribution (the normal
curve). |
|
|
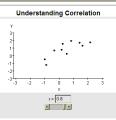
Correlation & Regression |
·
Scatterplot ·
Pearson’s Correlation
Coefficient (r) |
Slide the r value higher or lower and
the scatterplot pattern changes accordingly. |
|
|
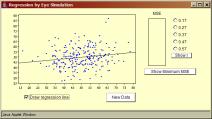
Correlation & Regression |
·
Guessing r ·
Regression line |
[Read description & then hit the
“Begin” button.] Study
the scatterplot, guess the correct value of r, then hit “Show r” to
test your stuff. You can also
have the computer plot the regression line at no extra charge. |
|
|
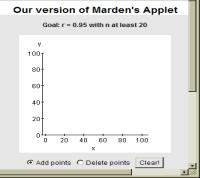
Correlation & Regression |
·
Plotting Scatterplot ·
Getting a particular r |
Plot points on scatterplot graph and
watch Pearson’s correlation coefficient change.
Screen challenges you to create a scatterplot that produces an r
equal to.95. |
|
|
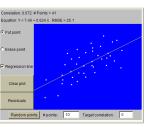
Correlation & Regression |
·
Plotting Scatterplot ·
Regression Line ·
Regression Formula ·
Changes in r |
Plot points and see immediate changes in
the correlation coefficient (r), the regression formula, and the
regression line. You can also
witness the impact of erasing a datapoint.
|
|
|
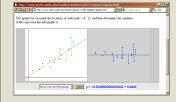
Correlation & Regression |
·
Regression ·
Prediction Error ·
Prediction Formula |
Plot scatter points and watch changes in
the slope of the regression line. Also
Shows the prediction error for each point.
Graph on the right plots the residuals. |
|
|
Graphs & Normal Curve 1-Sample t-tests |
·
Independent Variable (IV) ·
Dependent Variable (DV) ·
Frequency Distribution ·
Histogram ·
Hypothesis Testing |
[1] Complete a 40-trial reaction time
study and then see your response time distributions (as histograms) for
small and large targets. Simple
experiment testing whether manipulation of an IV creates a significant
(i.e., reliable) difference in the DV.
|
|
|
1-Sample t-tests |
·
[Distribution] ·
Normal Curve ·
T-test ·
Hypothesis Testing ·
Type II error |
[Select “1-sample hypothesis test”]
Shows Ho distribution for a 1-sample test with μ set to one. You then set the actual μ so the Ho is either easier to
reject (far from 1.0 ) or more difficult (close to 1.0).
Plot multiple samples and see the resulting t-values.
Shows the proportion of time you’ll make a Type II error. |
|
|
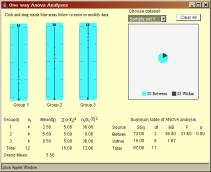
1-way ANOVA |
·
Distribution of scores ·
Within vs. Between Group Variance ·
Sources of Variation Table ·
Changing F |
[1] Create three samples by adding data
points where you choose – creating different patterns of within and
between variation. A
pie-chart shows the resulting pattern of within vs. between variability,
and a source of variation table shows how F changes accordingly. Also provides pre-made datasets. |
|
|
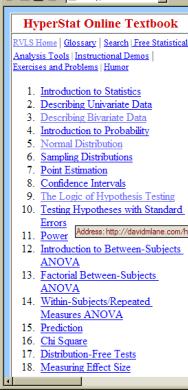
General Resource |
·
On-line stats text |
On-line statistics text with hyperlinked
definitions. Clarification is
only a click away! Consider
exploring the following chapters in particular: ·
Ch. 5:
Normal distributions ·
Ch. 6:
Sampling distributions ·
Ch. 9:
Logic of hypothesis testing |
|
|
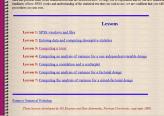
General Resource |
·
On-line SPSS help |
Help on: ·
Descriptive statistics ·
One-sample t-tests ·
Correlations ·
Regression ·
1-way ANOVA ·
2-way ANOVA |
|